A better "Net revenue" indicator
Our revenue graph was confusing. We fixed it.
Team Flower offers resources, classes and events for professionals of the floral industry. They use CashNotify, and recently suggested that we subtract fees from our “net revenue” graph:
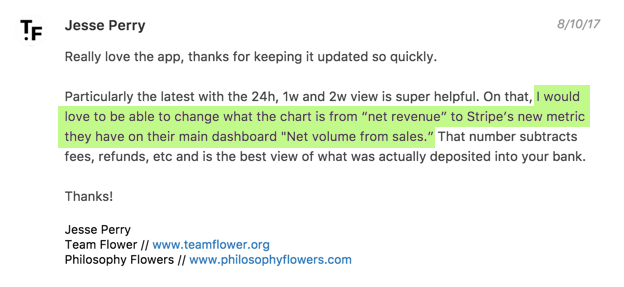
We agree with you, Jesse!
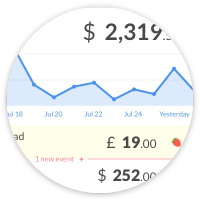
Until recently, the Stripe dashboard revenue graph only displayed a gross volume. It did not exclude refunds and was not the most useful indicator.
In CashNotify, we made the decision to deduct refunds from the beginning. But our graph did include fees, and thus did not represent the money transferred to your bank account.
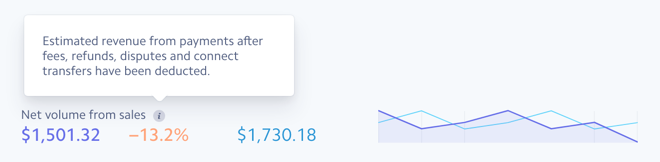
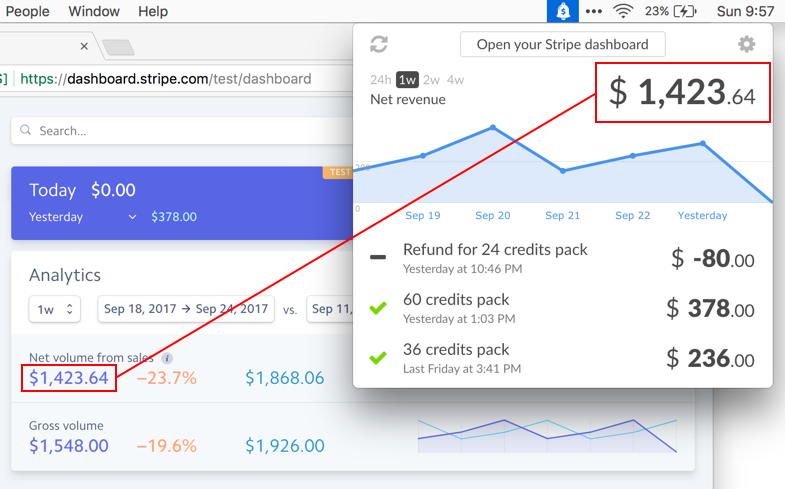
When Stripe added their “Net volume from sales” graph, it became obvious that our graph was not “net” at all. 😅
Our proposal
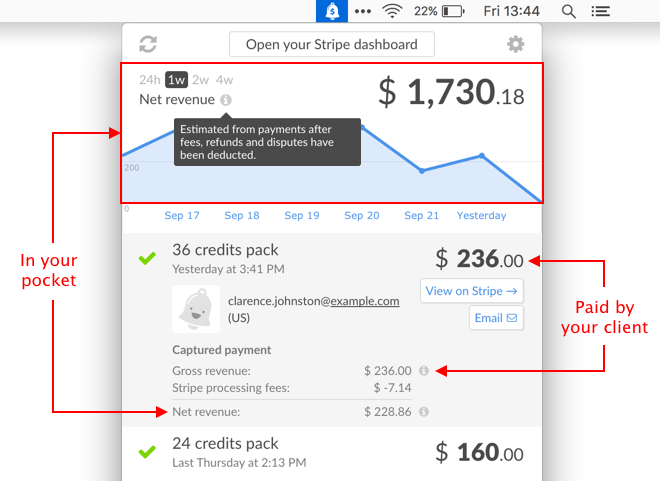
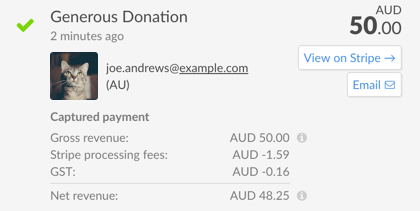
We’re adopting the same “net” definition as Stripe. And we’re adding the breakdown of fees within the event’s details.
The fee details are especially useful when a currency conversion occurs.

They also help understand the consequences of a partial refund on fees.
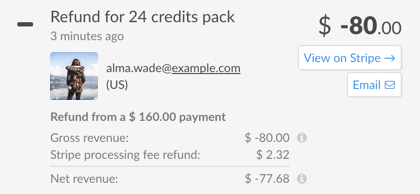
If they apply to your account, application fees and taxes are also listed.
Pushing consistency all the way
We know what would happen next. You would put Stripe and CashNotify side by side to compare the numbers and … it wouldn’t match! 😱
That’s because we didn’t have the same number of points on our graphs:
| Period | Stripe | CashNotify 2.4.3 |
|---|---|---|
| 1 week | 7 days = 7 points | 7 days + today = 8 points |
| 2 weeks | - | 14 days + today = 15 points |
| 4 weeks | 28 days = 28 points | 28 days + today = 29 points |
We’re changing this as well to match with Stripe.
From now on, our graphs will have the same number of points, and the numbers should match:
If the numbers don’t match, please get in touch. It’s possible that we missed something and we’d love to understand what.
Let us know what you think
We shipped this new feature in 2.5.2. Try it out with our free trial!
Photo credits: Ayo Ogunseinde, Jason Blackeye, Erica Leong